 Understanding the customer lifecycle is fundamental both in product design and customer management (CRM) in order to optimize engagement and, consequently, increase revenue and product sustainability. There is plenty of information on the web about what lifecycle is and its importance in business , marketing and strategy optimization. However, there is almost no information or references about how to measure the customer lifecycle. The little information out there is scarce, theoretical and subjective. Measuring the customer lifecycle allows us to understand which is the best time to send a promotion or to know how much time is needed for a customer to understand your product. The purpose of this article is to provide an objective and practical way to model and calculate the customer lifecycle in order to be able to define and set up marketing and product strategies with a better criteria.
Customer lifecycle basics
Although the concept of “life cycle” seems trivial and well known, there is much confusion and technical concepts that make it difficult to understand.
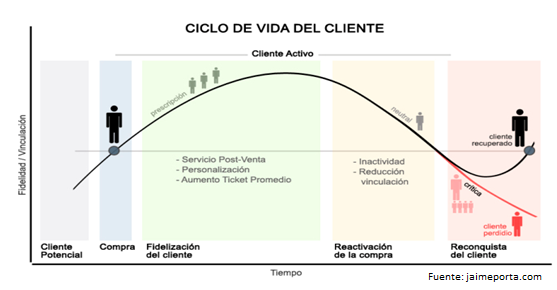
First of all, it is important to differentiate between the concept of customer lifecycle and customer lifetime value (known as LTV). The last one defines a monetary “value” expressed by a mathematical formula, while the customer life cycle describes the phases and stages that the customer passes through interacting with the product ussually expressed by a chart or state diagram.
Another term that often generates confusion with it is the costumer journey which consists of a “lean” tool to develop the user experience of the product. We could say that the lifecycle explains how customers interact with the product while the customer journey is a design tool that allows us to improve engagement by understanding the life cycle.
The need to model and measure the customer lifecycle
The managment team must understand the customer lifecycle. However, this is not enough nowadays where technologies allows us to measure absolutely everything. Most organizations know and understand their customer lifecycle but they do it in a theoretical and subjective way based on past experiences and intuitions.
The main advantage to model and measure the customer lifecycle allows us to respond objectively to customer and product management questions that otherwise would be answered based on the management team intuition. Some example questions could be when to send an informational email to customers or when to create a sales promotion.
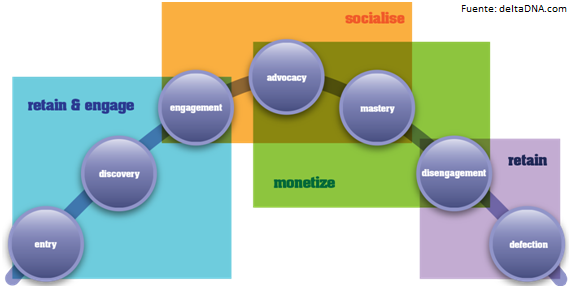
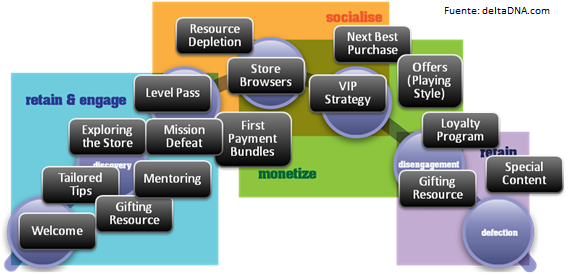
Lets suppose that we have modeled and constructed the previous lifecycle graph from our customers. Through this graph we could establish different strategies for each stage and state of the customers:
- For the phases of entry, discovery and engagement we could apply a retention and engagement strategies through tactics such as welcome messages, tips, tutorials, etc.
- For the stages of engagement, advocacy and mastery, where the customer reaches the highest level of engagement, we would apply socialization and monetization strategies with tactics such as first conversion messages, loyalty program, revenue management, VIP strategies, etc.
- For the states of disengagement and deflection we should focus on an strong retention strategy with tactics such as promotions, gifts, new content, special events, etc.
Looking at the previous graph we can see the customer lifecycle with different strategies and their respective tactics for each phase. However, at what exact moment we should apply each tactic? This is where most of the organizations get stuck because they do not objectively model and calculate their customer lifecycle.
Model the customer lifecycle
Representing the amount of use or engagement of a product from a customer (or group of customers – cohort) will allow us to obtain a representative graph of the customer lifecycle.
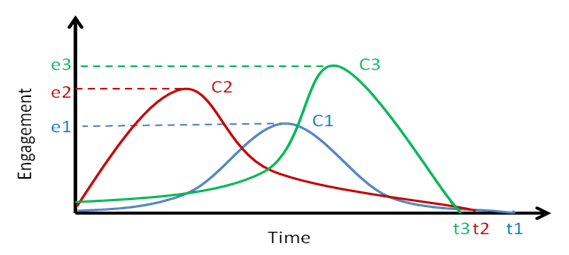
The previous graph shows the lifecycles from three different customers (or group of customers C1, C2 and C3). In the abscissa we represent the lifetime of such customers from the beginning to the end of its life while in the ordinates axis we represent the amount of engagement for each customer. Engagement can be measured by the metrics that the product team feels more confortable or believes its more appropiate to the product itself (number of sessions per day, average session time, number of events or actions, or even sales). The important thing is that ordinate represents the use of the product in a comparative way.
The values t1, t2 and t3 represent the cutoff points with zero engagement, or otherwhise expressed, indicate the total life time of each customer that will later be used for the LTV calculation. In contrast, the slopes of the curves and their distribution types (normal, binomial, right or left-skewed, etc.) indicate the engagement level for each t-value.
From these graphs we can obtain what are the key points such as the “aha moments”, moments of maximum engagement and moments of boredom or decline. Understanding these graphs in an objective way will allow us to establish strategies to enhance those moments. For example, at the initial customer stages we can focus the product and customer management efforts on learning and onboarding, in the phase of maximum engagement we can focus on retention and conversion and in the decline phase on reactivation and cross promoting or cross selling other products. These graphs will not only allow us to define strategies, but will also help us to measure how the product evolves.
Measure the customer lifecycle
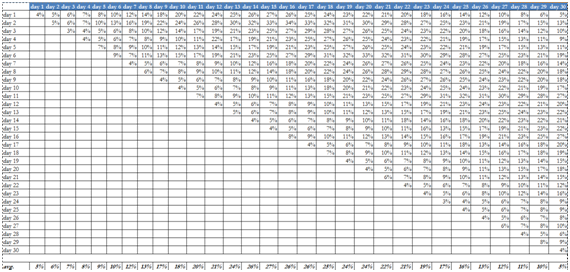
Once understood the model and its objective is the moment to obtain the data to be represented in the graph. The calculation will be made through engagement cohorts (or the product use data chosen). Once calculations have been made, it is enough to represent the data obtained from the cohorts through graphs. The resulting model is the customer lifecycle respresentation that we have seen in the previous section, but this time, with numbers.
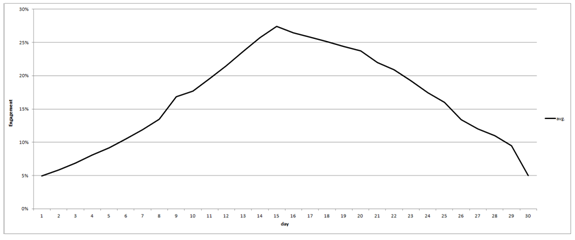
Using the chart above, we could make the following management and product assumptions:
- From day 1 to 8 do nothing, since the evolution is of product learning.
- From day 8 start with monetization stategies because the customer already knows the product and begins to use it more often.
- Day 15 is the key moment where the customer starts to lose interest. At that time we could unlock additional features or make some special event accompanied by a communication.
- From day 20 or 21 the strategy would be focused on keeping the customer or trying to cross it to another product.
- On the 28th, we might have lost the customer.
If we perform aggresive strategies on certain days and re-calculate the chart, we can see the effectiveness of the changes have. For example we can see if those changes have encoureged the customer to not leave the product the 28th day but a little bit later. The goal of the product and customer management team is to achieve the highest engagement point (e max ) in the shortest time possible and sustain it over time.
I hope this article has allowed the reader to gain a better insight into what the customer lifecycle is, what are their utilities in different business areas and how to be able to put into practice the monitoring of the different stategies applied through modeling and measuring the customer lifecycle.